This page contains a collection of images of Mars obtained from the NASA IRTF during the 1994-95 and 1996-97 apparitions. The images were obtained by Jim Bell, Bill Golisch, Dave Griep, Charlie Kaminski, Christophe Dumas, and Jeff Moersch.
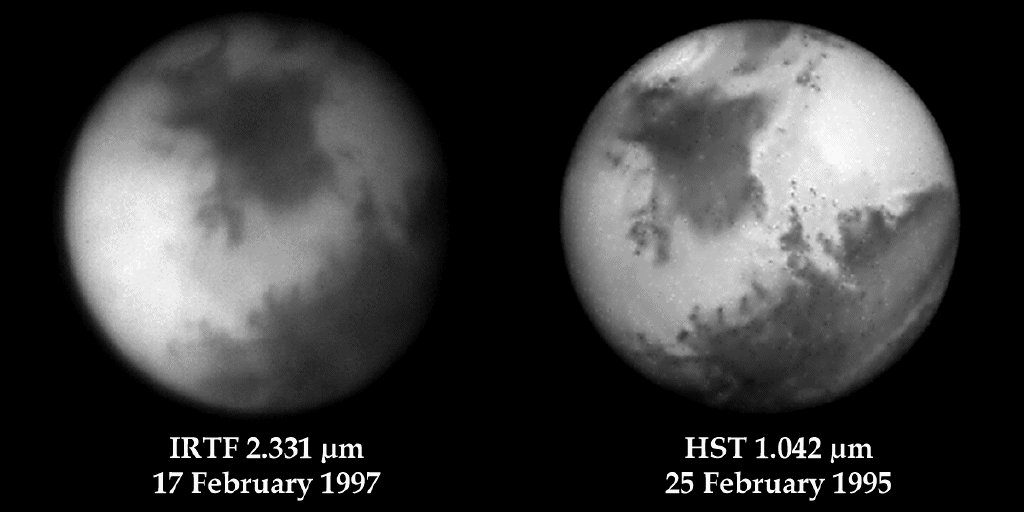
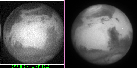
February 17, 1997 IRTF image, compared to HST
Playing the image back at a frame rate of 30 msec/frame yields a "real time" movie showing what Mars would look like if you were peering through the eyepiece of the 3-meter telescope on Mauna Kea (that is, of course, if the telescope actually HAD an eyepiece...). The wiggling of the planet from frame to frame is caused by the slight movement of the telescope by the wind; beneath this wiggling you can see variations in the seeing or fuzziness of the atmosphere. For a few of the frames in this movie, the seeing is exceptional! Can you find these magic frames?

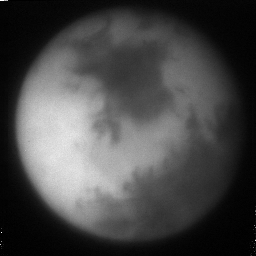
 February 15-16, 1997 Lowell and IRTF images
 (GIF, 40K)
 1995 AAS/DPS Presentation in Kona
 Time-series mosaic (77649 bytes)
 Feb. 4 1995 Mosaic (347613 bytes)
 Dec. 27 1994 Mosaic (146938 bytes)
 January 14, 1995 (A, B, C) and
PCA transforms the data set from a space of wavelengths to a space of eigenvectors which lie along progessively decreasing variation. The greatest variaition is surface albedo and so this is the first principal component. The next greatest variation to come out of PCA is a trait related to temperature and water ice content. Images B and E show how each region relates to this trait. Bright areas such as the polar regions and morning and evening regions are high in this trait and centrally located, warmer, dark regions have a negative correlation with this trait.
Areas with extreme correlations of the first two principal components are then taken to be spectral endmember regions and the disk is modeled as a linear combination of these endmember regions. The north polar region is taken as an endmember due to its high correlation with the temperature/ice principal component. Images C and F are maps of the fractional abundance of the north polar region spectral endmember and morning and evening regions show up to 50% composition. This indicates that these regions are cold and to some degree covered with water frosts. Note that in these images the entire disk is not modeled. Regions too near the limb are dominated by non-linear processes in their spectra and so are left unmodeled by this linear technique.
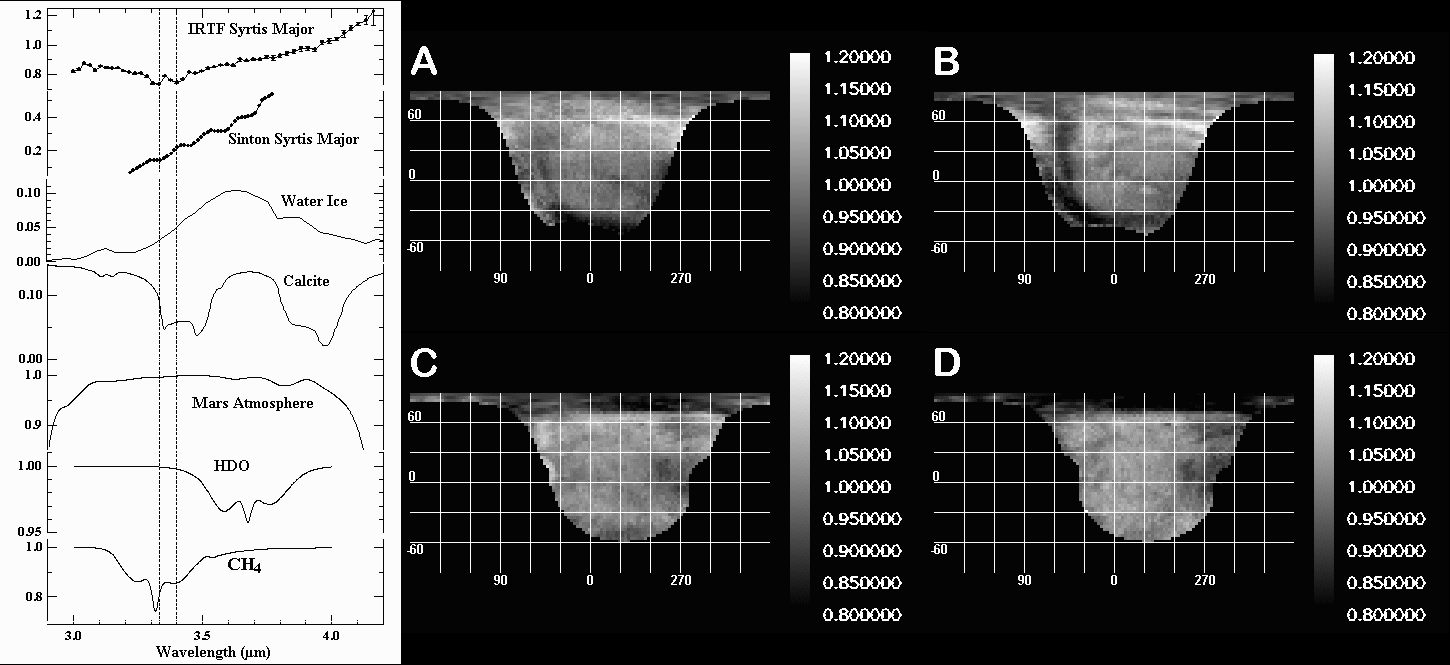 Sinton bands in February 1995 IRTF images
The images next to the spectral plots are relative band depth maps (RBDM). These maps are the ratio of the image at the absorption wavelength (3.331µm for A and C, and 3.401µm for B and D) to a continuum image at that wavelength calculated from linear interpolation of two nearby local continuum images (at 3.194 and 3.497µm). In all images but B, Syrtis Major appears as a 5-10% absorption feature. In the 3.4µ RBDM water ice can dominate the map and thus the disappearance of Syrtis Major relative to the surrounding area due to the effects of evening water ice clouds.
For information contact Jim Bell