NIS Calibration Report #10
Jim Bell and Andy Switala; 7/18/95
Issue:
Detector spatial scans (cross-slit) from May OCF tests
NOTE: The next several reports will be rather crude because we don't have time to spit and polish them properly. We will concentrate on showing major results rather than talking about details of derivations...
Methods:
(1) Use the May 13-15 OCF data for NIS placed on retro by Scott. In particular, we examined the file NIEMH02.135
(2) 10 measurements were made in each block of data. We calculated averages and standard deviations for each block and plotted the results on a 3-D plot to verify data quality and assess the character of the scans.
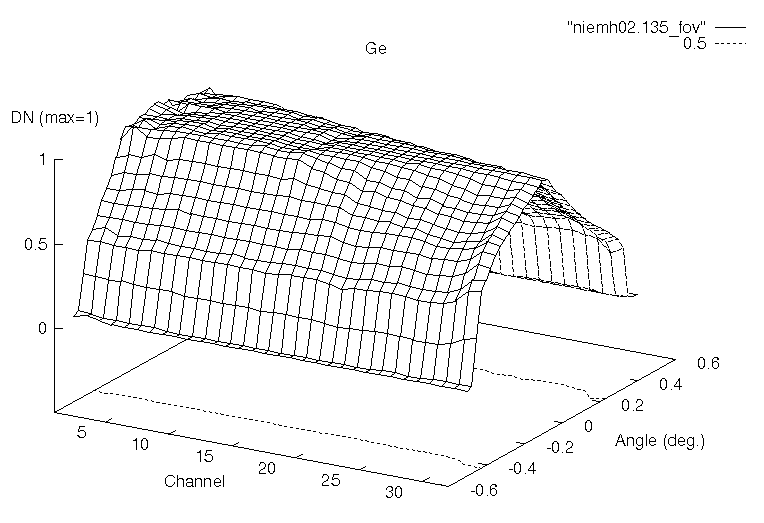
Figure 1 shows a plot of the Ge detector cross-slit spatial response pattern as a function of channel number and cross-slit angle. Four different perspective views are shown so that all parts of this surface can be seen. The dashed line on the x-y plane is the projection of the FWHM DN values for each channel.

Figure 1a: Ge spatial scan (cross-slit) results. View 1.
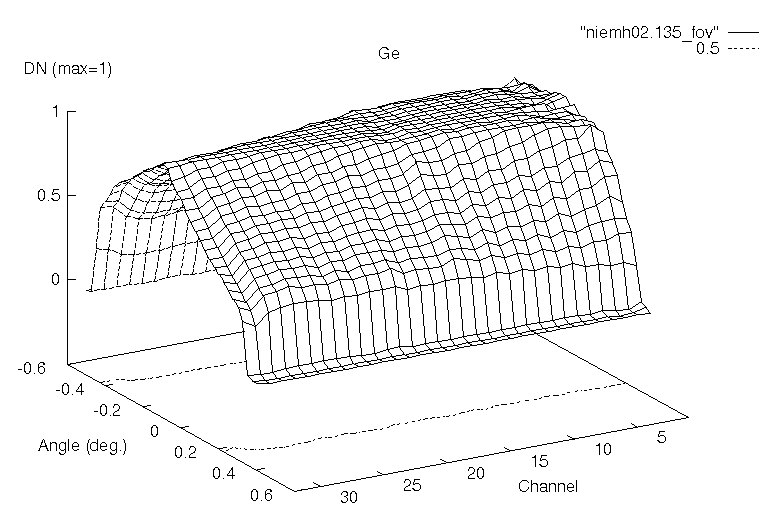
Figure 1b: Ge spatial scan (cross-slit) results. View 2.
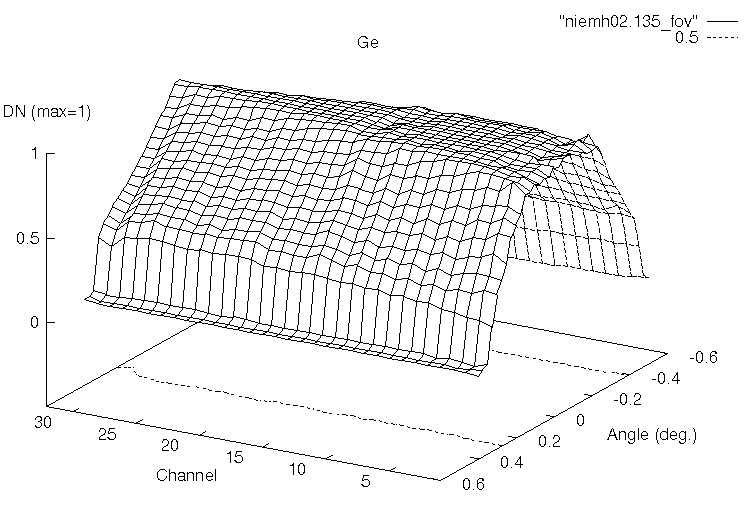
Figure 1c: Ge spatial scan (cross-slit) results. View 3.
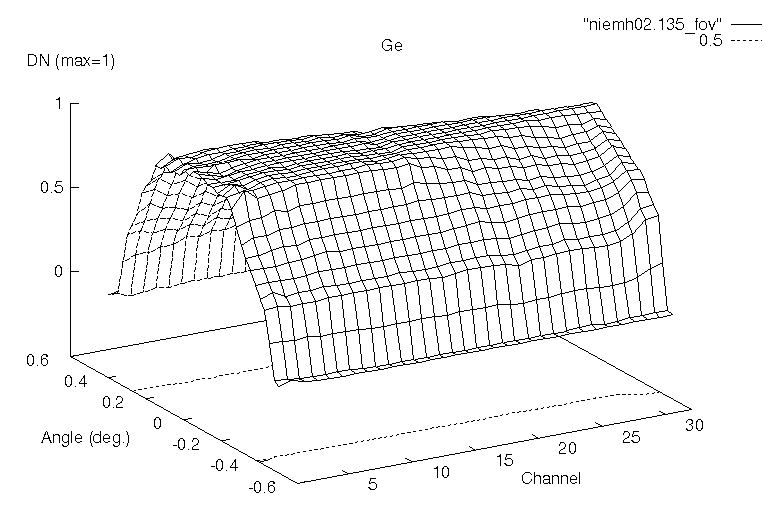
Figure 1d: Ge spatial scan (cross-slit) results. View 4.
Figure 2 shows a plot of FWHM (in degrees) for the Ge as a function of channel number.

Figure 2: Ge spatial scan FWHM (degrees) vs. channel. This is an approximate measure of the FOV of the array.
Figure 3 shows a plot of the InGaAs detector cross-slit spatial response pattern as a function of channel number and cross-slit angle. Four different perspective views are shown so that all parts of this surface can be seen. The dashed line on the x-y plane is the projection of the FWHM DN values for each channel.
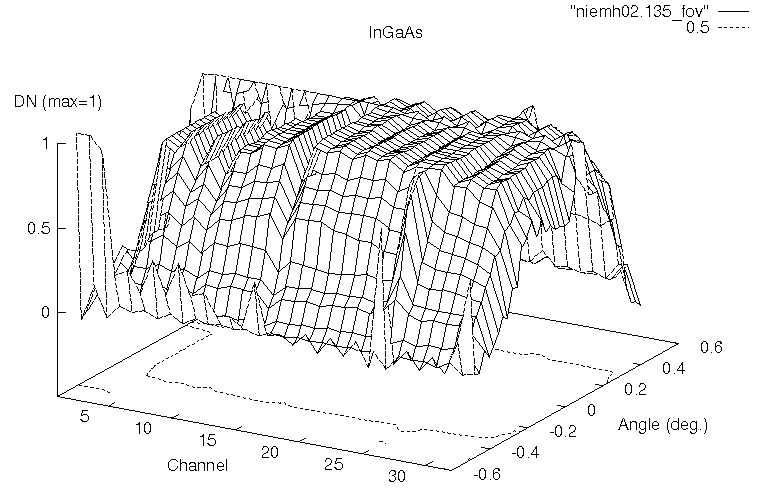
Figure 3a: InGaAs spatial scan (cross-slit) results. View 1.
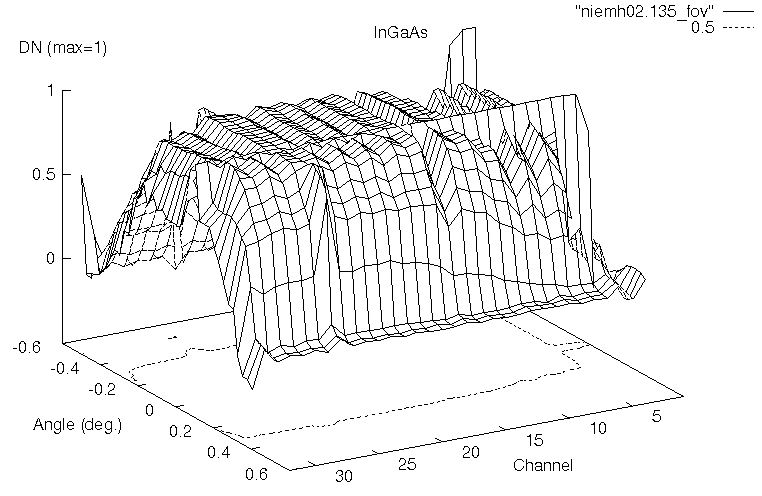
Figure 3b: InGaAs spatial scan (cross-slit) results. View 2.
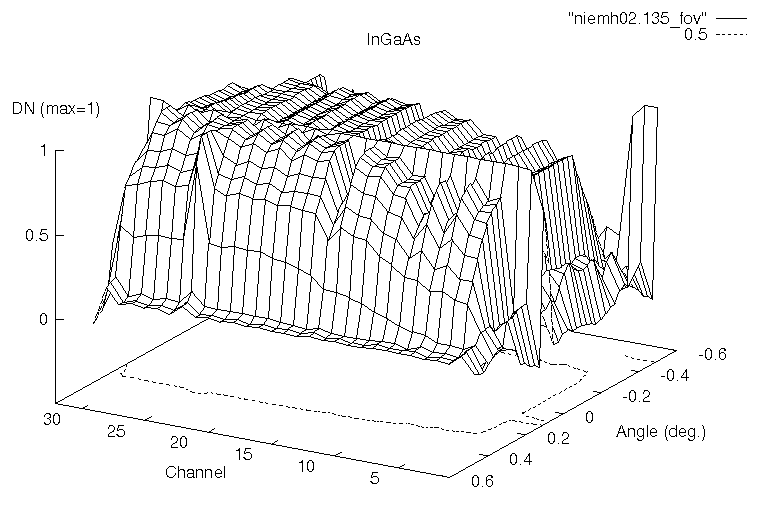
Figure 3c: InGaAs spatial scan (cross-slit) results. View 3.
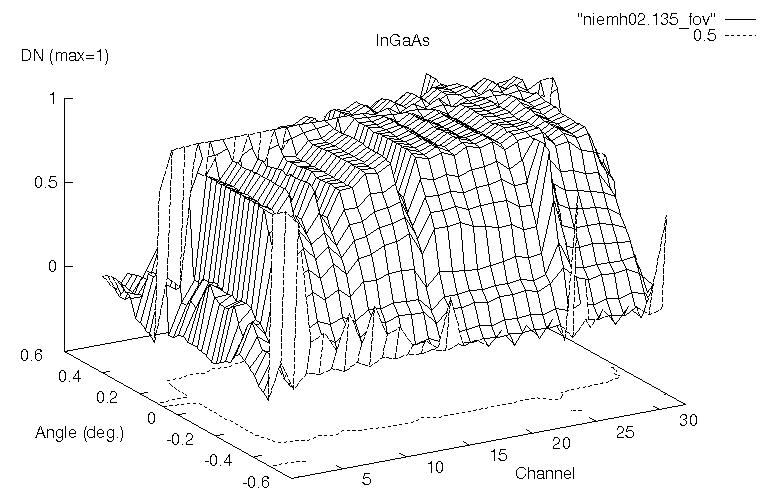
Figure 3d: InGaAs spatial scan (cross-slit) results. View 4.
Figure 4 shows a plot of FWHM (in degrees) for the InGaAs as a function of channel number.

Figure 4: InGaAs spatial scan FWHM (degrees) vs. channel. The top panel shows the full range of FWHM values; the bottom panel zooms in on the well-behaved channels. This is an approximate measure of the FOV of the array.
Summary of Results:
(UNDER CONSTRUCTION)