
Figure 1 Caption
Near-Infrared Imaging of Mars from HST:
Surface Reflectance, Photometric Properties, and Implications for MOLA Data
James F. Bell III
Cornell University, Department of Astronomy, Ithaca, NY 14853.
Michael J. Wolff
Space Science Institute, 1540 30th Street, Suite 23, Boulder, CO 80303-1012
Thomas C. Daley
Cornell University, Department of Astronomy, Ithaca, NY 14853.
David Crisp
Jet Propulsion Laboratory/Caltech, 4800 Oak Grove Dr., Pasadena CA 91125
Philip B. James
Department of Physics and Astronomy, Univ. of Toledo, Toledo, OH 43606
Steven W. Lee
LASP, University of Colorado, Boulder CO
John T. Trauger and Robin W. Evans
Jet Propulsion Laboratory/Caltech, 4800 Oak Grove Dr., Pasadena CA 91125
Submitted to Icarus March 24, 1997
Manuscript #6888
Accepted October 9, 1998
Manuscript Pages: 23
Tables: 2
Figures: 5
Proposed Running Head:
Bell et al.: Near-IR Imaging of Mars from HST
Please address all correspondence to:
Jim Bell
Cornell University
Department of Astronomy
402 Space Sciences Building
Ithaca, NY 14853-6801
phone: (607) 255-5911
fax: (607) 255-9002
email: jimbo@marswatch.tn.cornell.edu
Abstract
We report initial results from Hubble Space Telescope (HST) images of Mars obtained at a near-IR wavelength of 1042 nm between February 1995 and June 1997. The images provide the highest spatial resolution global near-IR measurements of Mars obtained to date. The data have been calibrated to radiance factor (I/F) to an absolute accuracy of 2% to 5% (including new refinements to several HST calibration parameters) and now exist as a set of coregistered, map-projected images spanning a range of phase angles between 10° to 41°. The relatively high spatial resolution (20-30 km/pixel) global maps, when compared with Viking-era global albedo maps, reveal that substantial variations in Mars surface albedo patterns have occurred in the past 20 years. The most obvious changes have involved several classical dark regions becoming substantially brighter, although there are examples in the data of formerly bright regions that have darkened. The normal albedo of typical surface regions in the near-IR is derived from the multiple phase angle observations and is found to be bimodal with typical bright and dark values of 0.36 and 0.18, respectively. The near-IR phase coefficient of surface regions ranges from ~ 0.0 to 0.013 mag/deg, and there is no systematic correlation between phase coefficient and normal albedo. This observation is consistent with the diffusely scattering nature of the Martian atmosphere even during times of low dust opacity. The data presented here may help in the planning and optimization of measurements to be obtained by the Mars Orbiter Laser Altimeter (MOLA) on the Mars Global Surveyor orbiter, scheduled to begin mapping the planet in 1999. These HST data also provide a basis for comparison with future MOLA and Mars Orbiter Camera (MOC) data in searches for seasonal and interannual variations in surface and polar cap albedo variations.
Introduction
Determination of the absolute reflectivity of a planetary surface is critical for deriving photometric properties such as albedo, phase function, macroscopic roughness, and opposition surge magnitude and width (e.g., Hapke, 1993; Helfenstein and Veverka, 1987). In addition, quantitative and realistic determinations of mineral abundances on a planetary surface using spectral mixture modeling require as inputs accurate knowledge of the absolute reflectivity of both the mixed spectrum and of a number of potential endmember materials (e.g., Mustard and Pieters, 1989; Adams et al., 1993). The issue of spectral mixing is relevant to Mars because the detailed surface composition and mineralogy is still largely unknown, and the measurements used to try to redress this gap in knowledge are frequently obtained over a range of spatial scales from centimeters (surface landers) to thousands of kilometers (groundbased telescopes). Measurement of the absolute surface reflectivity in the visible and near-infrared is particularly important for Mars, as there are a number of spectrally-active and geologically important minerals with spectral features in this wavelength range (e.g., Gaffey et al., 1993; Clark et al., 1993), some of which have already been unambiguously detected on the Martian surface from remote sensing measurements (see reviews by Soderblom, 1992; Roush et al., 1993; Bell, 1996).
However, the absolute reflectivity of the Martian surface in the near-IR is poorly known, despite many spacecraft investigations of Mars and decades of groundbased multispectral imaging and near-IR spectroscopy. This is because of the lack of any systematic near-IR studies on previous spacecraft missions and the inherent difficulties and uncertainties involved in absolute photometric calibration of extended, time-variable sources using groundbased observational techniques. Calibrated radiance factor measurements (I/F, where I is the flux measured from the surface and
pF is the incident solar flux; Hapke, 1981) exist for a few surface regions in the near-IR, obtained by the Mariner 6,7 IRS and Phobos-2 ISM instruments. The Mariner data have recently been heroically resurrected and recalibrated to I/F (e.g., Martin, 1985; Calvin, 1996), but their spatial coverage is limited to very small surface regions (because these missions were flybys) and their spectral coverage does not extend below 1800 nm. The Phobos-2 ISM data cover near-IR wavelengths from 770 to 3140 nm but only over a limited part of the equatorial region of Mars (Bibring et al., 1990). The data have been calibrated to I/F (Mustard et al., 1993), but the calibration scheme relies partly upon groundbased data, and thus carries with it some perhaps large associated degree of uncertainty.Recognizing this need for well-calibrated measurements, we embarked upon a series of ultraviolet through near-IR observations of Mars using the Hubble Space Telescope (HST). The observations began in 1990 (James et al., 1994, 1996; Bell et al., 1997), and are designed to take images in many wavelengths diagnostic of atmospheric or mineralogic absorption features. Most importantly for the work presented here, many HST images of Mars have been obtained at 1042 nm, the longest near-IR wavelength possible using the pre-February 1997 HST instrument suite. The major advantages of HST images are that they are free from telluric atmospheric contamination and that they can be accurately calibrated to within a few percent using the results from the rigorous program of frequent HST standard star observations. Another distinct advantage is that imaging with HST in certain modes and at certain times can allow very high (by groundbased standards) spatial resolution measurements to be made of the Martian surface. For example, HST images of Mars obtained during the 1997 opposition achieved a spatial resolution of 22 km/pixel at the sub-Earth point, comparable to the resolution obtained by the Phobos-2 ISM instrument from Martian orbit.
In addition to providing critical information for surface photometric and spectral mixing studies, accurately calibrated near-IR measurements of Mars could also substantially aid the interpretation of the results of upcoming spacecraft investigations. For example, the Mars Global Surveyor (MGS) spacecraft will begin a 2-year mapping reconnaissance mission of the red planet in early to mid-1999 (Albee, 1998). MGS carries four of the six primary science instruments from the ill-fated Mars Observer mission (Albee et al., 1992), and will thus recover a substantial amount of the science that was lost when Mars Observer fell silent in August 1993. Included in the MGS instrument suite is the Mars Orbiter Laser Altimeter (MOLA), which consists of a diode-pumped Nd:YAG, Q-switched, laser transmitter (1064 nm) and 50-cm diameter Cassegrain telescope coupled with a Silicon Avalanche Photodiode detector and associated altimeter receiver electronics (Zuber et al., 1992). MOLA has been designed primarily to determine the global topography of Mars over a 0.2°
¥0.2° grid with a vertical accuracy ² 30 m. A second objective of the MOLA investigation is to determine the global surface reflectivity at the wavelength of the Nd:YAG laser, 1064 nm, in order to contribute to studies of Martian surface mineralogy and polar cap variations. Independent determination of the near-IR reflectivity of the Martian surface prior to the MOLA mapping investigation will assist the MOLA team in determining the expected signal level and signal-to-noise ratio performance of the instrument (Zuber et al., 1992). Near-IR reflectivity measurements will also help with instrument calibration and the investigation of surface reflectance variations by providing baseline measurements against which the MOLA data can be compared.This paper describes: (a) the near-IR observations of Mars that have been obtained between 1995 and 1997 and the methods that have been used to reduce and calibrate these images to radiance factor and to project the data onto a standard map base; (b) the overall nature of the near-IR reflectance of the Martian surface and how it compares to the visible and near-UV reflectances; and (c) some initial determinations of temporal variability in surface albedo marking and near-IR surface photometric properties determined from these measurements.
Observations and Calibration
The data set presented here is composed of 28 images of Mars obtained between 1995 February 23 and 1997 June 27 using the F1042M filter (mean
l = 1018.35 nm, bandpass = 36.5 nm) and the PC1 chip of the Wide Field/Planetary Camera 2 (WFPC2) instrument (Burrows et al., 1995). The images span two Mars apparitions and more than a Martian year, beginning at Ls=63° (Table 1). The sub-Earth latitude on Mars during this time period ranged from 17°N to 26°N, providing full views of the northern hemisphere, but coverage in the south only down to about 60°S. Phase angle coverage during this time included two sets of global measurements at about a=10° near the 1995 and 1997 oppositions and a larger cluster of observations ranging between a=29° to a=40°, at times farther from opposition. Detailed discussions of the data collection and calibration have been presented by Bell et al. (1997) and Wolff et al. (1997). Here we provide a brief outline of the procedures, focused mainly on newly-derived calibration results.The raw images were corrected for analog-to-digital conversion errors, bias and dark current, shutter shading effects, and flatfield variations using the standard procedures outlined by Lauer (1989) and Holtzman et al. (1995a,b). The reduced data were then corrected for bad pixels and cosmic ray hits using a fourth-order polynomial least-squares nearest neighbor fitting technique. Finally, in order to take advantage of the full potential spatial resolution of HST, a point spread function deconvolution was performed on the reduced images using 40 iterations of the damped Richardson-Lucy algorithm with a threshold noise parameter of 3 (White, 1994; Wolff et al., 1997).
The data were initially calibrated to flux units (W cm-2
µm-1) using the results of the extensive standard star observation and monitoring programs carried out by the Space Telescope Science Institute (STScI). However, given recent concerns regarding the photometric calibration of F1042M (Spencer et al., 1997; Baggett et al., 1997), we proceeded to derive our own calibration. We used the PC1 observations of two red stars (as opposed to the usual white dwarf target, GRW+70û 5824, in the STScI program): HD 10700 (t Cet, G8V) and HD 90839 (36 UMa, F8V). These proprietary data were kindly provided D. Schroeder and H. Ford. We performed aperture photometry on each of the six observations using the version of DAOPHOT found in the LickObservatory VISTA package. We noted that the standard aperture correction factor used in
WFPC2 photometry (0.1 mag for a 0.5 arcsecond aperture) was not appropriate for F1042M. Consequently, we integrated out to a radius of 80 pixels, beyond which there was no significant change (i.e. ³ 1%) in the total counts. We calculated the sky brightness using an annulus with radii of 85 and 95 pixels. Synthetic photometry was performed on the ground-based spectra of Sviderskiene (1988, 1992) with the throughput curves taken from the recent SYNPHOT update (Baggett et al., 1997). We found a value of 1.68x10⁻¹⁹ W cm-2
µm-1 per DN (1.68x10⁻¹⁶ ergs s-1 cm-2 Å-1 per DN) which is 85% of the 1997 SYNPHOT value. This number is consistent with the current re-analysis of the F1042M calibration by the STScI SYNPHOT group (S. Baggett, 1998, private communication). However, since their analysis for the PC1 chip is limited to comparisons with white dwarf observations, we adopt our photometric calibration without further modification. A similar analysis of photometry for the F953N filter, used during separate HST Mars observations by our group, revealed a revised value of 2.23x10⁻¹⁹ W cm-2 µm-1 per DN (2.23x10⁻¹⁶ ergs s-1 cm-2 Å-1 per DN), which is 96% of the 1997 SYNPHOT value.The flux values were then converted, using the methods of Roush et al. (1992) and Bell et al. (1994), to radiance factor or I/F (I = the actual irradiance received from Mars within each HST pixel and
pF = the theoretical irradiance received within each HST pixel from a perfectly diffusing Lambertian surface illuminated by the Sun and viewed at normal geometry at the heliocentric distance of Mars; Hapke, 1981). The absolute photometric errors in this calibration process are conservatively estimated to be approximately 2 to 5%, and this estimate is verified by the excellent agreement between calibrated HST data and previous calibrated groundbased and spacecraft measurements of Mars (e.g., McCord and Westphal, 1971; Mustard and Bell, 1994).The I/F images were converted from the normal telescopic perspective (orthographic view) to a coregistered set of map-projected data products. This was achieved through software that automatically finds and fits the elliptical limb of the planet and then uses the associated ephemeris information (sub-Earth latitude and longitude, north pole position angle, geocentric distance) to perform a fully ellipsoidal map projection of the data at a scale of 1°/pixel. Small errors in the ephemerides and in precisely fitting the limb and determining the center pixel in the orthographic images lead to slight latitude and longitude errors for mapped surface features using this approach. In order to achieve greater consistency with existing Mars albedo, topographic, and geologic maps, we developed an iterative scheme to "tweak" the ephemeris information and correlate the resulting map against the Viking Orbiter IRTM albedo map at the same scale (Pleskot and Miner, 1981; Paige et al., 1994). Despite the 20 year time interval and the changes in surface albedo noted below, there is still enough similarity between the gross nature of albedo features in the IRTM and HST data sets to allow matching of the HST mapping to within less than 0.5° of the Viking maps for much of the surface.
| Figure 1 Caption |
The final data set for use in this paper consists of 28 images calibrated to I/F and projected onto a standard (latitude, longitude) grid. Images from global observing sequences obtained on the same Martian day (Table 1) covered nearly all Martian longitudes and have been merged into global mosaics, constructed using a simple Minnaert photometric correction to reduce seams at longitude overlap regions. The Minnaert correction produces images of the modeled zero-phase albedo, (I/F)M, in terms of the original I/F such that (I/F)M = (I/F)[(cos i)k (cos e)k-1]-1, where i and e are the incidence and emission angles for each pixel in the image (Minnaert, 1941). For producing the global mosaics, we used a nominal value of k=0.7, consistent with previous estimates of the average photometric behavior of the Martian surface (e.g., Harris, 1961; Young and Collins, 1971; Binder and Jones, 1972; Erard et al., 1994; de Grenier and Pinet, 1995).
More details and derivations of the reduction, absolute photometric calibration, sources of calibration errors, and map projection of the WFPC2 Mars images can be found in Bell et al. (1997) and Wolff et al. (1997).
Results
Near-IR Reflectance.
Images of the 1042 nm Mars surface reflectance from February 1995 and March 1997 are presented in Figure 1. These global images are mosaics of four images that have been corrected with a simple Minnaert function as described above. Examination of the image histograms reveals the well-known bimodal nature of the surface albedo features. The majority of the surface is composed of bright regions with a relatively narrow distribution of 1042 nm (I/F)M values from 0.33 to 0.39 (FWHM). The dark regions have a broader distribution of albedos, ranging between 0.15 to 0.25. There are a smaller but still substantial number of regions with albedos between 0.25 and 0.33, and an even smaller subset of the brightest regions, corresponding to the north polar cap, with albedos greater than 0.39. For comparison, a similarly-projected image of the Viking IRTM broadband albedo data (0.3 to 3.0 µm) is shown in Figure 2 (Pleskot and Miner, 1981; Paige et al., 1994; Paige and Keegan, 1994).
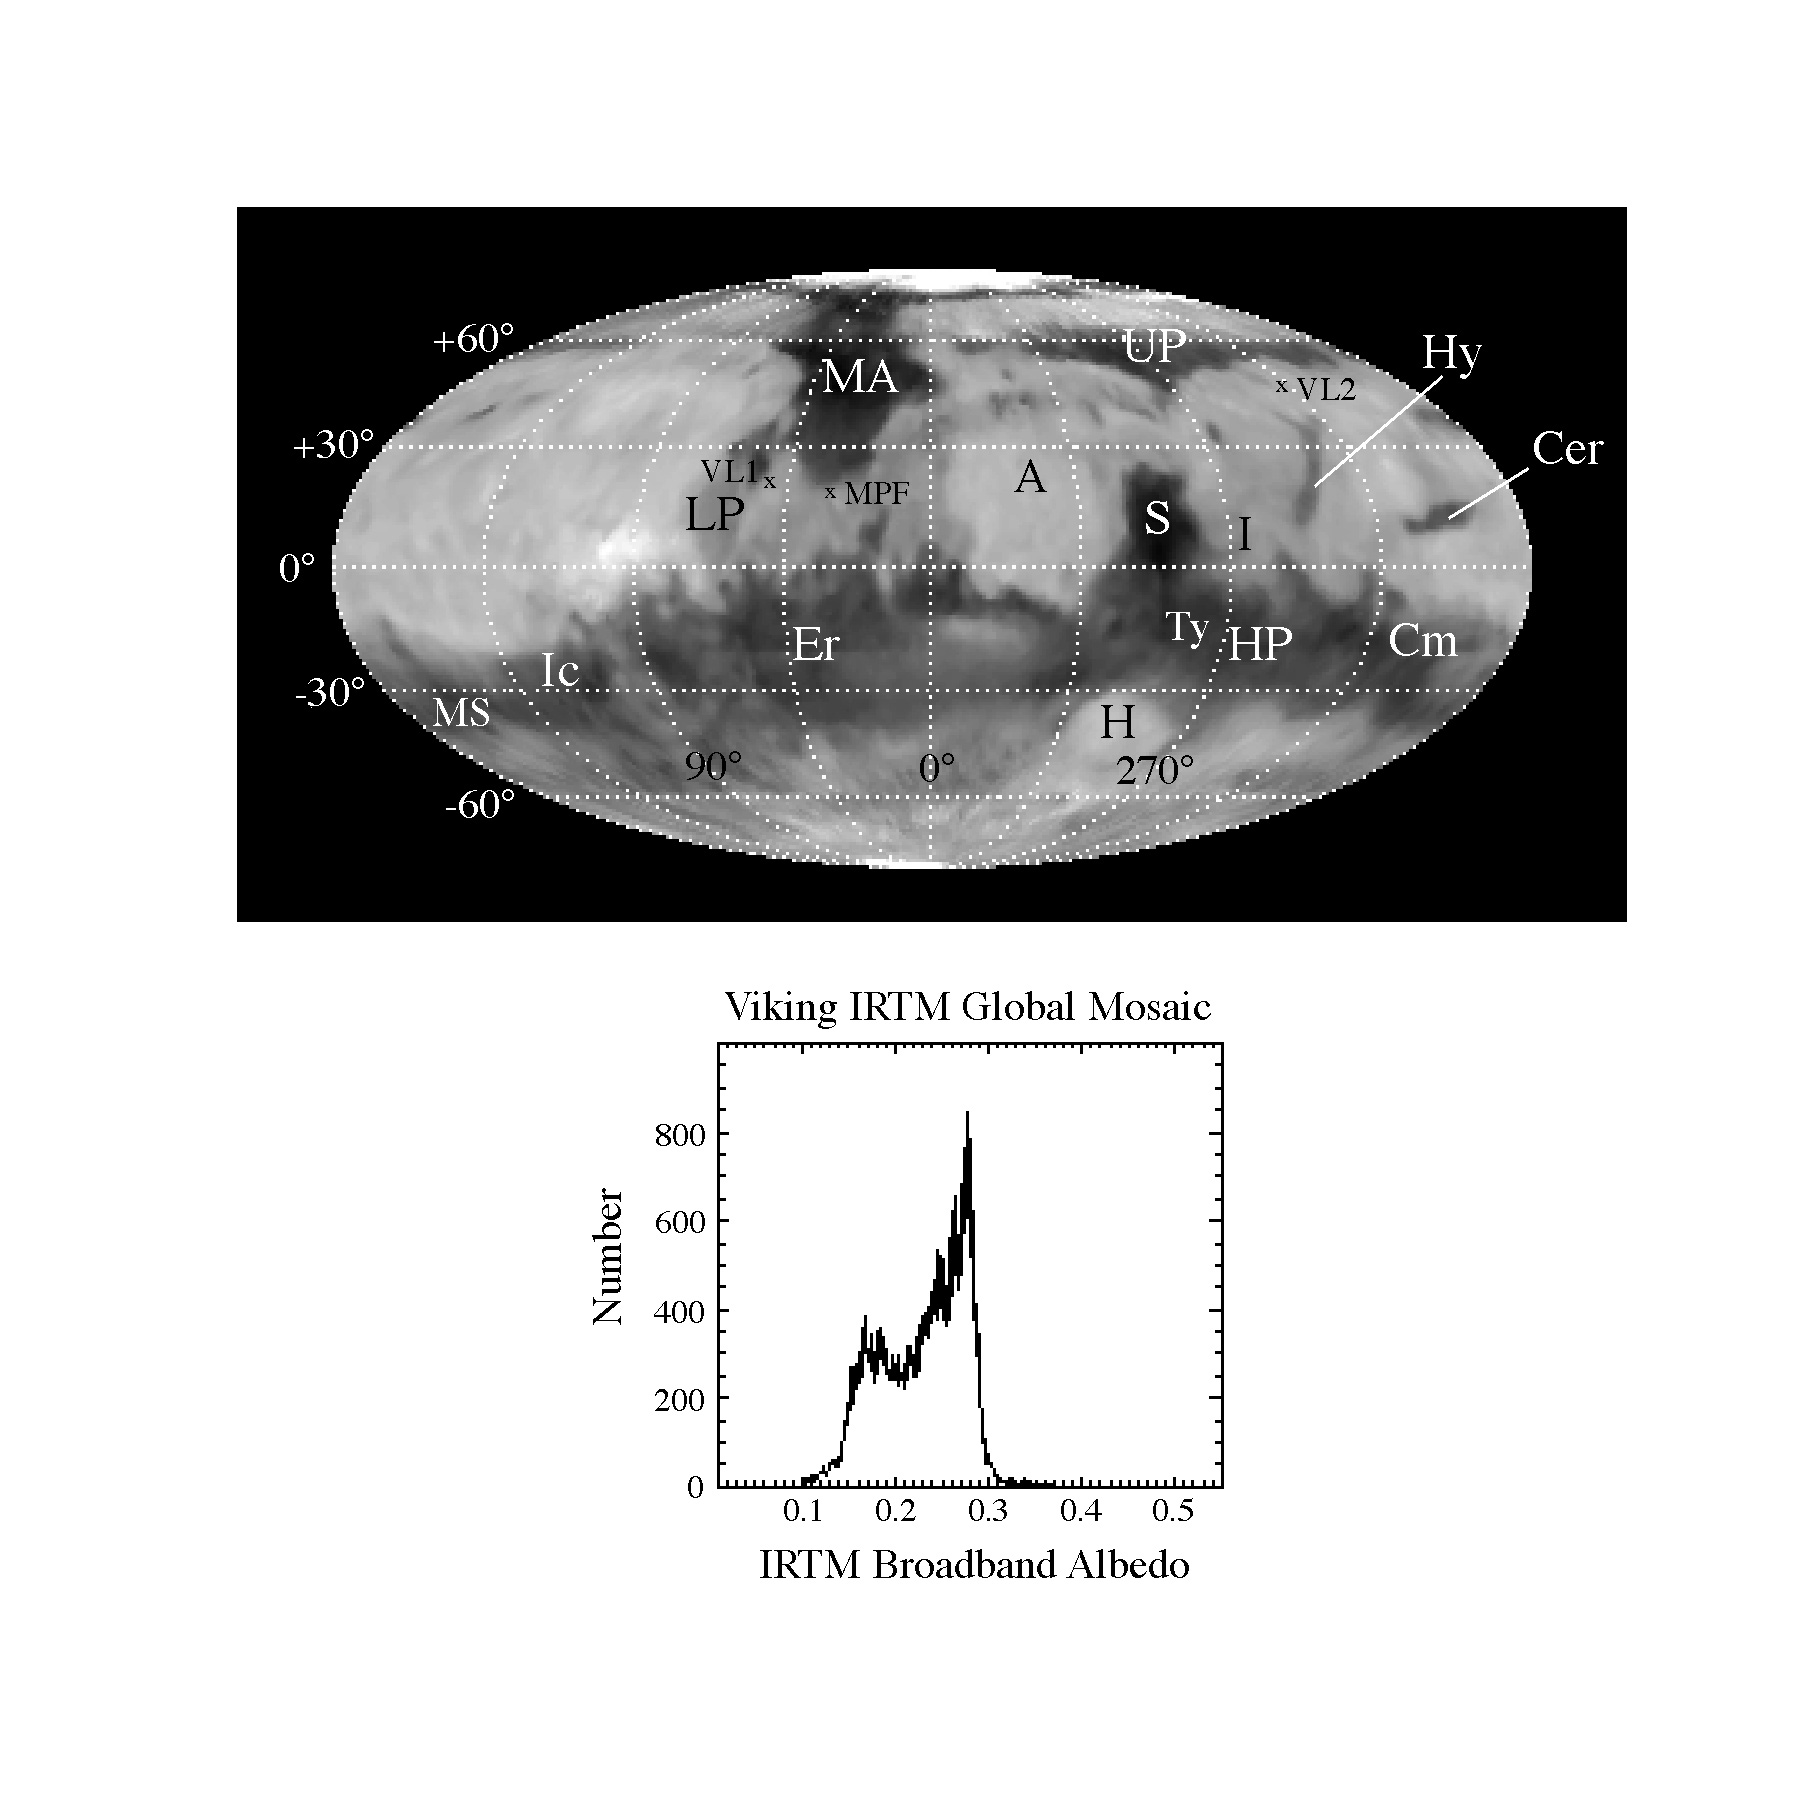 Figure 2 Caption |
Temporal Variations.
We can assess the short-term and long-term variations in surface albedo features using these new HST data in combination with previous groundbased, HST, and spacecraft images. During the period from February 1995 to June 1997 we saw no evidence for major changes in surface albedo markings, although regional dust storm activity was seen during this time in the northern polar regions (Wolff et al., 1996; James et al., 1996b). The lack of major surface albedo variations is consistent with the observations of James et al. (1994), who saw no variations in the Syrtis Major region in HST imaging during 1990 and 1991 and attributed this to the general absence of major atmospheric dust activity over the past decade. Information on smaller regional surface albedo changes is difficult to obtain by intercomparing this data set because of the large changes in spatial resolution over the course of the observing period. We are, however, able to verify that the only small regional feature known to have changed based on previous HST imaging (Cerberus, near latitude 15°N, longitude 205°W; James et al., 1996a; Lee et al., 1998), has not returned to its dark, pre-HST appearance (cf. Figures 1 and 2).
Much more striking variations in surface albedo markings can be seen by comparing the recent HST 1042 nm images to the 1977-era Viking Orbiter IRTM broadband albedo map and by making the assumption that overall reflectivity variations, rather than spectral slope or photometric changes, are responsible for large differences between these two data sets (Figure 3). While this assumption is supported by the high level of correlation of albedo features from filter to filter in the HST data, we tested more rigorously the validity of direct comparison of HST 1042 nm images and Viking 300-3000 nm IRTM data by using composite 200-4200 nm Mars spectra (Mustard and Bell, 1994; Ockert-Bell et al., 1997). The composite spectra were multiplied by the solar irradiance and then convolved over the bandpasses of both the IRTM solar channel (Chase et al., 1978) and the HST F1042M filter (Burrows, 1995). Predicted I/F values were generated by ratioing the integrated Mars
¥ Sun ¥ responsivity value to the integrated Sun ¥ responsivity value for each filter (Ockert-Bell et al., 1997, eq. 5). We used six composite spectra spanning the full range of albedo units and found an extremely high linear correlation (r = 0.999) between IRTM-derive I/F values and F1042M-derived I/F values. IRTM I/F values are systematically lower than those in F1042M, however, because the IRTM solar channel irradiance is dominated by flux from near the peak of the Sun's irradiance in the visible, where the planet's reflectivity is lower than in the 1000 nm near-IR region. Our derived ratio of average simulated IRTM solar channel I/F to average simulated HST F1042M I/F is 0.74±0.03, consistent with the observed I/F differences between the global map histograms in Figures 1 and 2. Thus, despite the additional influence of variations in color, near-IR spectral slope, and atmospheric absorption band strength within the broad Viking IRTM solar channel bandpass, it appears that differences between HST 1042 nm images and IRTM albedo maps are dominated by actual surface reflectivity changes. 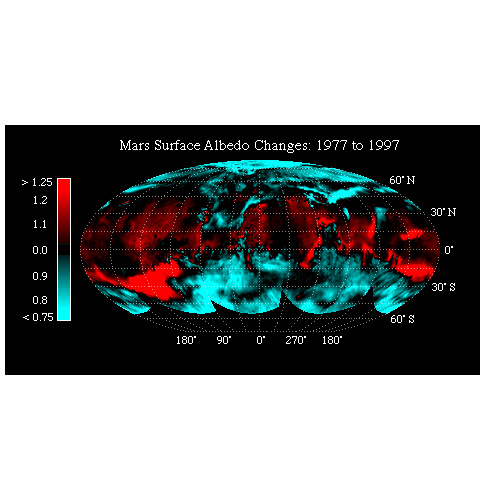 Figure 3 Caption |
Large changes in the relative reflectivity of several areas can be seen in Figure 3 over ~20 years. Many areas have become brighter and/or changed shape considerably. For example, the Icaria/Mare Sirenum region (near 30°S, 120°W) was a typical dark region in 1977, but now has a reflectivity more like a typical bright region. The boundaries of Syrtis Major and Hesperia Planum (15°S to 30°N, 220°W to 320°W) have receded by as much as several hundred km (a change larger than could be accounted for by only variations in effective spatial resolution of the two datasets). Much of northern Mare Cimmerium (near 15°S, 210°W) has changed from an intermediate albedo region to a typical bright region. Cerberus, as discussed above and in Lee et al. (1998), and the elongated Hyblaeus Chaos (30°N to 45°N, 240°W) have both brightened and changed shape considerably. Some regions have become darker over the past 20 years. For example, Mare Erythraeum (20°S, 30°W to 90°W), the northeast margin of the Hellas basin (30°S to 45°S, 270°W to 300°W), and the arrow-shaped southern tip of Utopia Planitia (45°N, 270°W). The changes observed in Figure 3 poleward of 70°N are primarily due to seasonal differences in the extent of the polar cap between the two data sets.
Photometric Properties.
Recently, substantial progress has been made in radiative transfer modeling of the physical and spectroscopic properties of airborne dust (e.g., Clancy and Lee, 1991; Pollack et al., 1995; Clancy et al., 1995; Ockert-Bell et al., 1997; Wolff et al., 1998). All of these models require as inputs accurate estimates of the normal albedo and phase coefficients of the Martian surface and/or airborne dust over a range of reflectivities and viewing geometries. The HST measurements discussed here span a wide range of phase angles and thus represent a new source of information that can be used in such modeling efforts. Determination of the phase function and phase coefficients is not straightforward, however, because of the complicating effects of scattering and absorption by aerosols in the Martian atmosphere (e.g., Clancy and Lee, 1991; Erard et al., 1994), and the variable spatial resolution of the images presented here. However, we present a simplified analysis of the phase coefficient for the surface at 1042 nm as a first step towards more detailed modeling and as a way to make some possibly useful initial results available for ongoing spacecraft investigations and other Mars surface and atmospheric modeling studies (e.g., Wolff et al., 1998).
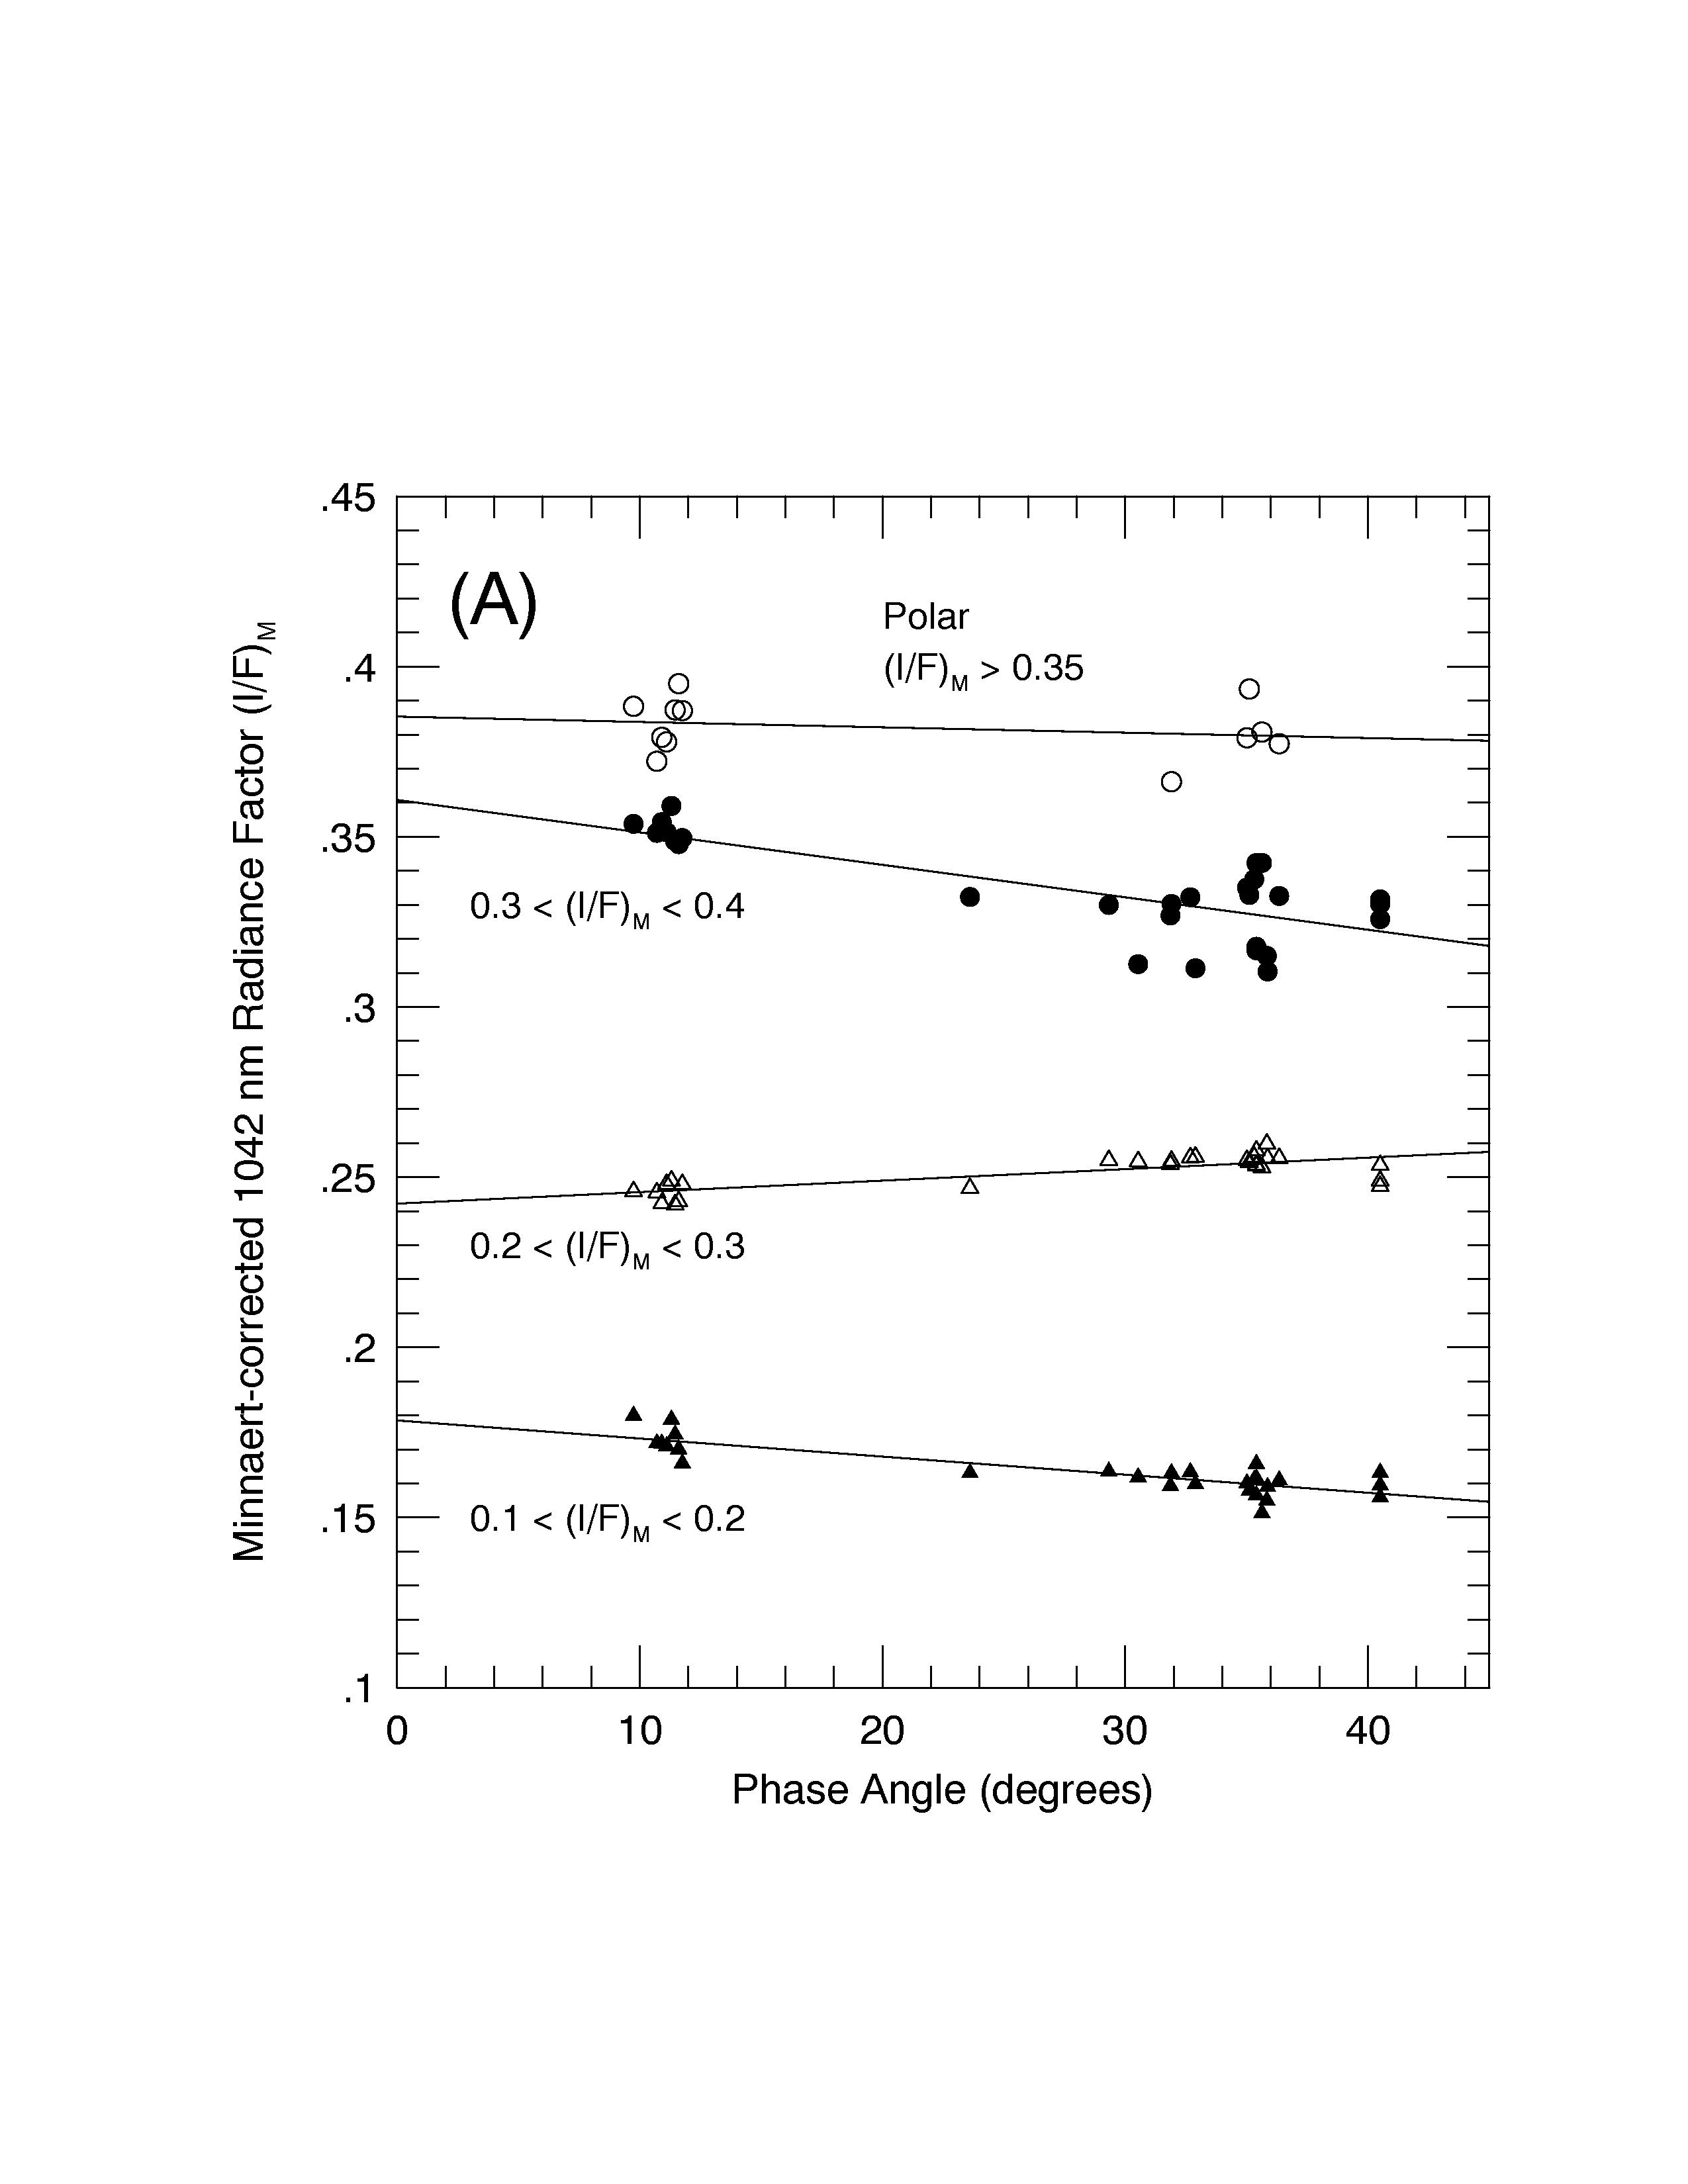 Figure 4 Caption |
After correcting the mapped images with a simple Minnaert function (k=0.7), we extracted (I/F)M values for average bright, dark, and polar cap surface regions as a function of phase angle (
a). We performed a linear least squares fit to the data to derive the normal albedo, (I/F0), or the radiance factor at a=0° (Hapke, 1993). The data were then converted to differential magnitudes (Dm) by dividing the Minnaert-corrected I/F values at phase angle a (I/Fa) by the normal albedo (I/F0), where Dm = -2.5log10[(I/Fa)/(I/F0)]. A linear least squares fit of Dm vs. a was then performed; the slope of this fit provides an estimate of the phase coefficient. The results are shown in Figure 4 and Table 2. Table 2 also presents normal albedo and phase coefficient results for a number of other smaller bright, dark, and intermediate albedo regions of interest.The normal albedo at 1042 nm for bright surface regions and the north polar cap ranges from 0.36 to 0.42. The normal albedo for dark regions is typically 0.19 to 0.21. There is a wide range in values for the phase coefficient, although typical values are rather small (0.0035±0.0003 mag/deg). There appears to be little correlation between phase coefficient and normal albedo, reflecting the diffusely-scattering nature of Martian atmospheric dust, even under low opacity circumstances. Both the range of values of the phase coefficient and the lack of a strong correlation between phase coefficient and albedo are consistent with previous groundbased, Mariner, and Viking phase function studies (e.g., Harris, 1961; Binder and Jones, 1972; Thorpe, 1977; Pleskot and Kieffer, 1977; Clancy and Lee, 1991). These new HST analyses, however, extend the photometric study of Mars into a higher spatial resolution near-IR realm than has been possible using previous methods, and they also allow for the long-term comparison of photometric properties among surface units.
 Figure 4 Caption |
Discussion
In the 20 year hiatus between the Viking missions and the Mars Pathfinder and Mars Global Surveyor missions, the only global-scale data with which to assess seasonal and longer timescale variations in the Martian surface and atmosphere have come from HST and other Earthbased telescopes. Determining the magnitude and extent of such variations, whether they be in atmospheric temperature structure, dust opacity, or in surface reflectivity variations, can help to constrain models of Martian atmospheric dynamics as well as of short- and long-term climate variations. In addition to filling this gap in time coverage, HST data are also providing the first relatively high spatial resolution global measurements of the planet in the near-IR. This paper has presented some of the first results from these near-IR images.
Surface Albedo Variations.
The variations in surface albedo markings observed in Figure 3 between 1977 and 1997 can be compared with observations and results derived from long-timescale groundbased telescopic observations and short-timescale Viking orbiter measurements of surface albedo changes. Slipher (1962) and Martin et al. (1992) provided extensive reviews of historical and more recent observations of surface albedo variations. The data reveal that the boundaries of Martian surface albedo features are continually changing and are usually not exactly reproduceable from year to year. However, there are a number of perennial large-scale albedo features, such as Syrtis Major, that have persisted in general form throughout the historical record despite local changes in their specific outlines. In that regard, the magnitude of the 20-year albedo variations observed in Figure 3 are not inconsistent with similar variations observed telescopically for hundreds of years.
The origin of large-scale albedo variations has been linked to dust deposition and removal processes by a number of groundbased and spacecraft investigations (e.g., Pollack and Sagan, 1967; Sagan et al., 1973; Christensen, 1986, 1988; Martin and Zurek, 1993). In particular, Viking IRTM albedo variations were interpreted by Christensen (1986, 1988) to indicate that low-albedo southern and mid-latitude regions are post-storm sources of dust, and that the dust preferentially accumulated in higher-albedo northern hemisphere regions during the course of the IRTM late 1970s observations. Our analysis of the differences between the 1997 HST and 1977 IRTM albedo data is consistent with continued general north to south accumulation of dust (many formerly intermediate albedo northern hemisphere regions appear to have brightened, and much of the classical low-albedo southern hemisphere has darkened) in the intervening 20 years. However, most of the large-scale regional increases in albedo (Icaria/Mare Sirenum, Mare Cimmerium) occurred in the southern hemisphere and are interpreted as regions of enhanced dust deposition since Viking. A logical prediction based on the IRTM and previous groundbased observations would be that these regions should be active sources of potential dust storms in the near future, eventually returning to their low-albedo appearance. Southern hemisphere dust activity reported in early MGS MOC and TES observations (Malin et al., 1998; Christensen et al., 1998) is consistent with this expectation, although the specific geographic regions where dust activity was noted by MGS (Noachis, Hellas) are not flagged in Figure 3 as regions of enhanced dust deposition in the past 20 years, possibly because such higher southern latitude regions were not well observable from Earthbased observations during the last few apparitions.
Implications for MGS/MOLA.
These data may prove useful to those working with the Mars Global Surveyor orbiter MOLA instrument, because they provide the most recent measurements of the Martian surface in a near-IR wavelength very close to that being used by MOLA to measure surface elevation, vertical ruggedness, and surface reflectivity variations (Zuber et al., 1992; Smith et al., 1998). Existing telescopic and spacecraft spectra of Mars show little spectral difference between 1042 nm and 1064 nm (e.g., Roush et al., 1993; Mustard and Bell, 1994), reinforcing the assumption that data at these two wavelengths are directly comparable and likely to be influenced by the same surface and/or atmospheric effects. Knowledge of the near-IR reflectivity of the surface is an important factor in planning for the MOLA measurements because the instrument's signal to noise ratio (and thus the vertical precision of the data) is partly a function of within-footprint (140 m diameter) surface reflectivity, although the vertical structure of terrain at footprint scales is the largest factor which influences final vertical precision (Zuber et al., 1992).
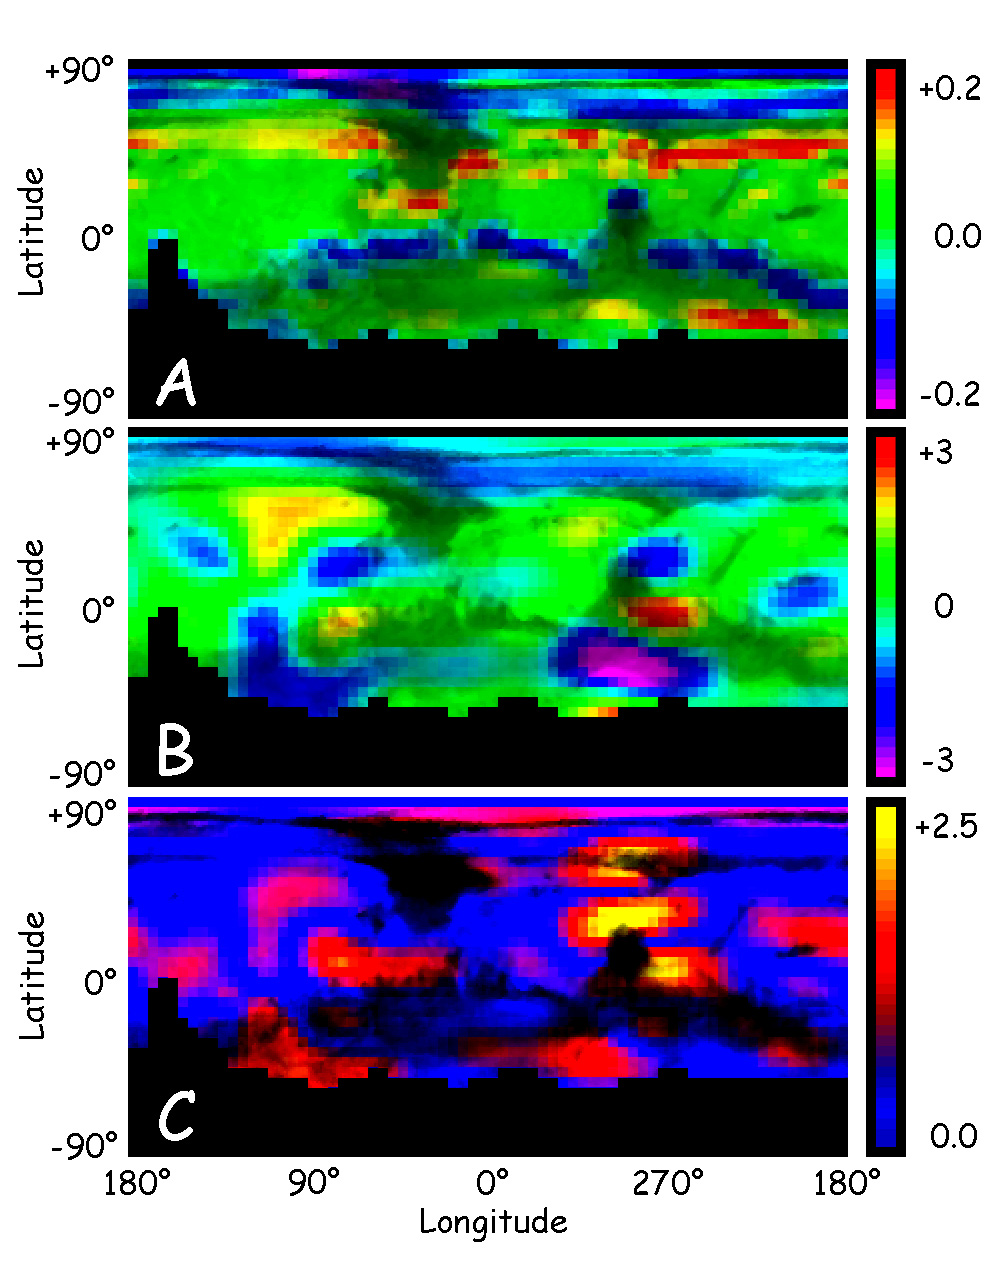 Figure 5 Caption |
In addition, MOLA employs a leading-edge tracking algorithm that is sensitive to footprint-scale reflectivity variations; in regions of rapidly changing surface reflectivity variations at MOLA's sampling scale (i.e., 330 m between 140 m diameter footprints), MOLA could have difficulty maintaining robust tracking at full vertical resolution, which could lead to a loss in ranging fidelity. While our HST measurements have much coarser spatial resolution than the typical MOLA surface footprint (140 m), we can provide some crude regional information on the Martian near-IR surface reflectivity gradient for use in planning of the MOLA observations. In Figure 5a we show the 1042 nm Mars reflectivity gradient, binned in 5°
¥5° intervals and displayed in a cylindrical projection map centered on 0° latitude, 0° longitude. We binned the data at 5°¥5° (roughly 300¥300 km at low latitudes) to compare it directly to the Smith and Zuber (1996) 5°¥5° global topographic model, currently the best-available geodetic-quality global topographic dataset (note however that the 1°¥1° USGS DEM for Mars is, in places, quite reliable for scientific use; Eliason et al., 1992). In Figure 5b we show the Mars topographic gradient derived from the Smith and Zuber (1996) data, for comparison with Figure 5a. In both of these figures the gradients have been calculated along lines of constant longitude, simulating the direction of the ground track of the MGS spacecraft in polar orbit. Figure 5a shows that there are many surface regions that will have high near-IR reflectivity gradients. These regions correspond primarily to the boundaries between the classical bright and dark areas, where the gradient is high because of the bimodal nature of the Martian surface albedo distribution (Figure 1). The highest reflectivity gradients occur along the boundary of the seasonal CO2 ice cap with the dark circumpolar annulus and the northern extent of Mare Acidalium, an area that also shows a moderately high negative topographic gradient (Figure 5b). While there is little or no overall correlation between the reflectivity and topographic gradients for the regions of Mars imaged by HST in the near-IR, a few areas do show a correlation between high reflectivity gradient and high topographic gradient. In Figure 5c these potential MOLA "trouble areas" are highlighted. The most prominent occur near the Isidis basin, near the topographic high between Isidis and Hellas in western Mare Tyrrhenum, and near Lunae Planum and the southern boundary of Mare Acidalium (near the Mars Pathfinder landing site). This comparison provides only a coarse regional view, but it demonstrates the types of regions where MOLA may have difficulty obtaining the highest fidelity ranging measurements. While the overall situation looks quite promising for MOLA's autonomous tracking algorithm (and initial aerobraking results reported since this paper was first submitted are excellent; Smith et al., 1998), the identification of these potential trouble spots from these new HST data may provide a more accurate way to assess (and optimize) the MOLA global mapping science return.HST measurements like those presented here also extend the time span for surface and polar cap albedo variation studies that will be substantially extended by future MOLA near-IR surface reflectivity measurements and very high resolution images from the MGS/MOC (Malin et al., 1998). And finally, previous studies have shown how these types of near-IR measurements, when combined with images at shorter wavelengths, could be used to search for and map the distribution and abundance of minerals like pyroxene, olivine, or iron oxides on the Martian surface (e.g., James et al., 1996; Bell et al., 1997).
Conclusions
(1) Measurements of the absolute reflectivity of Mars at a near-IR wavelength near 1042 nm have been obtained from the Hubble Space Telescope. Refinements have been made to the previously-published HST calibrations for the F953N and F1042M filters, resulting in data that have an accuracy of 2% to 5% and that represent the highest spatial resolution global near-IR measurements of Mars obtained to date.
(2) The images, obtained over a range of phase angles from 10° to 41°, reveal that the normal albedo of the surface in the near-IR is bimodal with typical bright and dark values of 0.36 to 0.42 and 0.19 to 0.21, respectively.
(3) Substantial variations in Mars surface albedo patterns have occurred in the past 20 years, despite much of this time being regarded by groundbased observers as a fairly "low dust" period. The most obvious changes have involved several classical dark regions (Icaria, Mare Sireumn, Mare Cimmerium, Cerberus) becoming substantially brighter, although there are examples in the data of some formerly bright regions that have darkened.
(4) The average Martian surface phase coefficient near 1042 nm is 0.0035±0.0003 mag/deg. While individual regions show significant variations in phase coefficients, there is no systematic correlation between phase coefficient and normal albedo. These results are consistent with previous groundbased and Viking measurements, and are likely related to the diffusely scattering nature of the Martian atmosphere even during times of low dust opacity.
(5) The data presented here may help in the planning and optimization of Mars Global Surveyor MOLA 1064 nm global topography/reflectivity measurements to begin in 1999, and they also provide a basis for comparison with future MOLA and MOC data in efforts to search for seasonal and interannual variations in surface and polar cap albedo variations.
Acknowledgments. We thank Jim Garvin of the MGS/MOLA instrument team for a formal review of the manuscript and for helping us to determine ways that these HST measurements could most benefit the planned MOLA observations. We also thank Wendy Calvin for detailed and constructive reviews, Dan Schroeder and Holland Ford for allowing us to use their proprietary images for our photometric calibration, David Golimowski for facilitating the data access, and Sylvia Baggett for helpful discussions regarding the SYNPHOT database. Funding for this research was provided by grants from the NASA Planetary Geology and Geophysics Program (NAGW-5062) and the Space Telescope Science Institute. This work is based on observations with the NASA/ESA Hubble Space Telescope obtained at the Space Telescope Science Institute, which is operated by Association of Universities for Research in Astronomy under NASA contract NAS5-26555. All of the data presented here are available in digital form to interested scientists, mission planners, or others; please contact the first author for access information.
References
Adams, J.B., M.O. Smith, and A.R. Gillespie 1993. Imaging spectroscopy: Interpretation based on spectral mixture analysis. In Remote Geochemical Analysis: Elemental and Mineralogical Composition (C. Pieters and P. Englert, Eds.), pp. 145-166. Cambridge Univ. Press.
Albee, A.L., F.D. Palluconi, and R.E. Arvidson 1998. Mars Global Surveyor mission: Overview and status, Science 279, 1671-1672.
Albee, A.L., R.E. Arvidson, and F.D. Palluconi 1992. Mars Observer mission. J. Geophys. Res. 97, 7665-7680.
Baggett, S., S. Casertano, S. Gonzaga, and C. Ritchie 1997. WFPC2 synphot update, Instrument Science Report WFPC2 97-10, Space Telescope Sci. Inst., Baltimore, MD.
Bell, J.F., III 1996. Iron, sulfate, carbonate, and hydrated minerals on Mars, in "Mineral Spectroscopy: A Tribute to Roger G. Burns," Geochemical Society Special Publication 5 (M.D. Dyar, C. McCammon, and M.W. Schaefer, Eds.), 359-380.
Bell, J.F., III, J.B. Pollack, T.R. Geballe, D.P. Cruikshank, and R. Freedman 1994. Spectroscopy of Mars from 2.04 to 2.44 µm during the 1993 opposition: Absolute calibration and atmospheric vs. mineralogic origin of narrow absorption features. Icarus 111, 106-123.
Bell, III, J.F., M.J. Wolff, P.B. James, R.T. Clancy, S.W. Lee, and L.J. Martin 1997. Mars surface mineralogy from Hubble Space Telescope imaging during 1994-1995: Observations, calibration, and initial results, J. Geophys. Res.
Bibring, J.-P., Combes, M., Langevin, Y., Cara, C., Drossart, P., Encrenaz,T., Erard, S., Forni, O., Gondet, B., Ksanfomality, L.V., Lellouch, E., Masson, P., Moroz, V.I., Rocard, F., Rosenqvist, J., Sotin, C., and Soufflot, A. 1990. ISM observations of Mars and Phobos: First results. Proc. Lunar Planet. Sci. Conf. 20th, 461-471.
Binder, A.B. and J.C. Jones 1972. Spectrophotometric studies of the photometric function, composition, and distribution of the surface materials of Mars. J. Geophys. Res. 77, 3005-3020.
Burrows, C.J. (Ed.) 1995. Wide Field and Planetary Camera 2 Instrument Handbook, version 3.0, Space Telescope Science Institute Publication, STScI, Baltimore MD.
Calvin, W.M. 1997. Variation of the 3-µm Absorption feature on Mars: Observations over eastern Valles Marineris by the Mariner 6 infrared spectrometer. J. Geophys. Res. 102, 9097-9107.
Chase, S.C., J.L. Engel, H.W. Eyerly, H.H. Kieffer, F.D. Palluconi, and D. Schofield 1978. Viking Infrared Thermal Mapper, Appl. Opt. 17, 1243-1251.
Christensen, P.R. 1986. Regional dust deposits on Mars: Physical properties, age, and history, J. Geophys. Res. 91, 3533-3545.
Christensen, P.R. 1988. Global albedo variations on Mars: Implications for active aeolian transport, deposition, and erosion, J. Geophys. Res. 93, 7611-7624.
Christensen, P.R., D.L. Anderson, S.C. Chase, R.T. Clancy, R.N. Clark, B.J. Conrath, H.H. Kieffer, R.O. Kuzmin, M.C. Malin, J.C. Pearl, T.L. Roush, and M.D. Smith 1998. Results from the Mars Global Surveyor Thermal Emission Spectrometer, Science 279, 1692-1698.
Clancy, R.T. and S.W. Lee 1991. A new look at dust and clouds in the Mars atmosphere: Analysis of emission-phase-function sequences from global Viking IRTM observations, Icarus 93, 135-158.
Clancy, R.T., S.W. Lee, G.R. Gladstone, W.W. McMillan, and T. Roush 1995. A new model for Mars atmospheric dust based upon analysis of ultraviolet through infrared observations from Mariner 9, Viking, and Phobos, J. Geophys. Res. 100, 5251-5264.
Clark, R.N., G.A. Swayze, A.J. Gallagher, T.V.V. King, and W.M. Calvin 1993. The U.S.G.S. Digital Spectral Library: Version 1: 0.2 to 3.0 µm. U.S. Geol. Surv. Open File Report 93-592.
de Grenier, M. and P.C. Pinet 1995. Near-opposition Martian limb darkening: Quantification and implication for visible—near-infrared bidirectional reflectance studies. Icarus 115, 354-368.
Eliason, E., R. Batson, and S. Wu 1992. Mars Mosaicked Digital Image Model (MDIM) and Digital Terrain Model, NASA Planetary Data System CDROM VO_2007, National Aeronautics and Space Administration, Washington D.C.
Erard, S., J. Mustard, S. Murchie, J.-P. Bibring, P. Cerroni and A. Coradini 1994. Martian aerosols: Near-infrared spectra properties and effects on the observation of the surface. Icarus 111, 317-337.
Gaffey, S.J., L.A. McFadden, and D.B. Nash 1993. Ultraviolet, Visible, and Near-Infrared reflectance spectroscopy: Laboratory spectra of geologic materials. In Remote Geochemical Analysis: Elemental and Mineralogical Composition (C. Pieters and P. Englert, Eds.), pp. 43-71. Cambridge Univ. Press, Cambridge.
Hapke, B. 1981. Bidirectional reflectance spectroscopy: 1. Theory, J. Geophys. Res. 86, 3039-3054.
Hapke, B., Theory of Reflectance and Emittance Spectroscopy, 455 pp., Cambridge Univ. Press, New York, 1993.
Harris, D.L. 1961. Photometry and colorimetry of planets and satellites. In, The Solar System. III. Planets and Satellites, pp. 272-342. (G.P. Kuiper and B. Middlehurst, Eds.), Univ. of Chicago Press, Chicago.
Helfenstein, P. and J. Veverka 1987. Photometric properties of lunar terrains derived using Hapke's equation, Icarus 72, 342-357.
Holtzman, J. A., J. J. Hester, S. Casertano, J. T. Trauger, A. M. Watson, G. E. Ballester, C. J. Burrows, J. T. Clarke, D. Crisp, R.W. Evans, J.S. Gallagher III, R.E. Griffiths, J.G. Hoessel, L.D. Matthews, J.R. Mould, P.A. Scowen, K.R. Stapelfeldt, and J.A. Westphal 1995a. The performance and calibration of WFPC2 on the Hubble Space Telescope. Pub. Astron. Soc. Pac. 107, 156-178.
Holtzman, J.A., C.J. Burrows, S. Casertano, J.J. Hester, J.T. Trauger, A.M. Watson, and G. Worthey 1995b. The photometric performance and calibration of WFPC2. Pub. Astron. Soc. Pac. 107, 1065-1093.
James, P.B., J.F. Bell III, R.T. Clancy, S.W. Lee, L.J. Martin, and M.J. Wolff 1996a. Global imaging of Mars by Hubble Space Telescope during the 1995 opposition, J. Geophys. Res. 101, 18,883-18,890.
James, P.B., M.J. Wolff, R.T. Clancy, S.W. Lee, J.F. Bell III, and L.J. Martin 1996b. Synoptic monitoring of Mars by HST: 1996-1997 observations (abstract), Bull. Amer. Astron. Soc. 28, 1069.
James, P.B., R.T. Clancy, S. Lee, L.J. Martin, R.B. Singer, E. Smith, R. Kahn, R. Zurek 1994. Monitoring Mars with the Hubble Space Telescope: 1990-1991 observations, Icarus 109, 79-101.
Lee, S., M.J. Wolff, J.E. Moersch, R. McKim, D. Parker, P.B. James, J.F. Bell III, and R.T. Clancy 1998. The disappearance of the Cerberus albedo feature on Mars: Analysis of Hubble Space Telescope and Viking IRTM data, submitted to Icarus.
Lauer, T.R. 1989. The reduction of Wide Field/Planetary Camera images. Pub. Astron. Soc. Pac. 101, 445-469.
Malin, M.C., M.H. Carr, G.E. Danielson, M.E. Davies, W.K. Hartmann, A.P. Ingersoll, P.B.James, H. Masursky, A.S. McEwen, L.A. Soderblom, P. Thomas, J. Veverka, M.A. Caplinger, M.A. Ravine, T.A. Soulanille, and J.L. Warren 1998. Early views of the Martian surface from the Mars Orbiter Camera of Mars Global Surveyor, Science 279, 1681-1685.
Martin, L.J. and R.W. Zurek 1993. An analysis of the history of dust activity on Mars, J. Geophys. Res. 98, 3221-3246.
Martin, L.J., P.B. James, A. Dollfus, K. Iwasaki, and J.D. Beish 1992. Telescopic observations: Visual, photographic, polarimetric, in Mars (H.H. Kieffer, B.M. Jakosky, C.W. Snyder, and M.S. Matthews, Eds.), pp. 34-70, Univ. of Arizona Press, Tucson.
Martin, T.Z. 1985. Dataset restoration: The Mariner 6/7 infrared spectrometer (abstract) Bull. Amer. Astron. Soc. 17, 723.
McCord, T.B. and J.A. Westphal 1971. Mars: Narrowband photometry, from 0.3 to 2.5 microns, of surface regions during the 1969 apparition. Astrophys. J. 168, 141-153.
Minnaert, M. 1941. The reciprocity principle in lunar photometry. Astrophys. J. 93, 403-410.
Mustard, J.F. and C.M. Pieters 1989. Photometric phase functions of common geologic materials and applications to quantitative analysis of mineral mixture reflectance spectra. J. Geophys. Res. 94, 13,619-13,634.
Mustard, J.F. and J.F. Bell III 1994. New composite reflectance spectra of Mars from 0.4 to 3.14 µm, Geophys. Res. Lett. 21, 353-356.
Mustard, J.F., S. Erard, J.-P. Bibring, J.W. Head, S. Hurtrez, Y. Langevin, C.M. Pieters, and C.J. Sotin 1993. The surface of Syrtis Major: Composition of the volcanic substrate and mixing with altered dust and soil, J. Geophys. Res. 98, 3387-3400.
Ockert-Bell, M.E., J.F. Bell III, C.P. McKay, J.B. Pollack, and F. Forget 1997. Absorption and scattering properties of the Martian atmospheric dust in the solar wavelengths, J. Geophys. Res. 102, 9039-9050.
Paige, D.A., J.E. Bachman, and K.D. Keegan 1994. Thermal and albedo mapping of the polar regions of Mars using Viking thermal mapper observations, 1, North polar region, J. Geophys. Res. 99, 25,959-25,991.
Paige, D.A. and K.D. Keegan 1994. Thermal and albedo mapping of the polar regions of Mars using Viking thermal mapper observations, 2, South polar region, J. Geophys. Res. 99, 25,993-26,014.
Pleskot, L.K. and H.H. Kieffer 1977. The infrared photometric function of Mars and its bolometric albedo. Icarus 30, 341-359.
Pleskot, L.K. and E.D. Miner 1981. Time variability of martian bolometric albedo. Icarus 45, 179-201.
Pollack, J.B. and C. Sagan 1967. Secular changes and dark-area regeneration on Mars, Icarus 6, 434-439.
Pollack, J.B., M.E. Ockert-Bell, and M.K. Shepard 1995. Viking Lander image analysis of Martian atmospheric dust, J. Geophys. Res. 100, 5235-5250.
Roush, T.L., E.A. Roush, R.B. Singer, and P.G. Lucey 1992. Estimates of absolute flux and radiance factor of localized regions on Mars in the 2-4 µm wavelength region, Icarus 99, 42-50.
Roush T.L., Blaney D.L., and Singer R.B. 1993. The surface composition of Mars as inferred from spectroscopic observations. In Remote Geochemical Analysis: Elemental and Mineralogical Composition (C. Pieters and P. Englert, Eds.), pp. 367-393. Cambridge Univ. Press, Cambridge.
Sagan, C., J. Veverka, P. Fox, R. Dubisch, R. French, P. Gierasch, L. Quam, J. Lederberg, E. Levinthal, R. Tucker, B. Eross, and J.B. Pollack 1973. Variable features on Mars. 2. Mariner 9 global results, J. Geophys. Res. 78, 4163-4196.
Slipher, E.C. 1962. Mars: The Photographic Story. 168 pp., Sky Publishing Corp, Cambridge MA.
Smith, D.E. and M.T. Zuber 1996. The shape of Mars and the topographic signature of the hemispheric dichotomy. Science 271, 184-188.
Smith, D.E., M.T. Zuber, H.V. Frey, J.B. Garvin, J.W. Head, D.O. Muhleman, G.H. Pettengill, R.J. Phillips, S.C. Solomon, H.J. Zwally, W.B. Banerdt, and T.C. Duxbury 1998. Topography of the northern hemisphere of Mars from the Mars Orbiter Laser Altimeter, Science 279, 1686-1692.
Soderblom, L.A. 1992. The composition and mineralogy of the martian surface from spectroscopic observations: 0.3-50 µm. In Mars (H.H. Kieffer, B.M. Jakosky, C.W. Snyder, and M.S. Matthews, Eds.), pp. 557-593. Univ. of Arizona Press, Tucson.
Spencer, J. R., A.S. McEwen, M.A. McGrath, P. Sartoretti, D.B. Nash, K.S. Noll, and D. Gilmore 1997. Volcanic resurfacing of Io: post-repair HST imaging, Icarus 127, 221-237.
Sviderskiene, Z. 1988, Energy distribution in the stellar spectra of different spectral types and luminosities. V. Normal stars, Vilnius Astronomical Observatory Bulletin 80, 7-104.
Sviderskiene, Z. 1992, Energy distribution in the stellar spectra of different spectral types and luminosities. V. Metal-deficient stars, Vilnius Astronomical Observatory Bulletin 86, 3-13.
Thorpe, T.E. 1977. Viking Orbiter photometric observations of the Mars phase function: July through November 1976, J. Geophys. Res. 82, 4161-4165.
White, R. L. 1994. Image restoration using the Damped Richardson-Lucy method. In The Restoration of HST Images and Spectra II (R. J. Hanisch, and R. L. White, Eds.), Space Telescope Science Institute, pp. 104-110.
Wolff, M.J., S.W. Lee, R.T. Clancy, L.J. Martin, P.B. James, and J.F. Bell III 1997. Observations of dust storms on Mars with the Hubble Space Telescope. J. Geophys. Res. 102, 1679-1692.
Wolff, M.J., J.F. Bell III, P.B. James, R.T. Clancy, and S.W. Lee 1998. Hubble Space Telescope observations of Mars prior to the Mars Pathfinder mission: Water ice cloud and dust optical depths, submitted to J. Geophys. Res.
Young, A.T. and S.A. Collins. 1971. Photometric properties of the Mariner cameras and of selected regions on Mars. J. Geophys. Res. 76, 432-437.
Zuber, M.T., D.E. Smith, S.C. Solomon, D.O. Muhleman, J.W. Head, J.B. Garvin, J.B. Abshire, and J.L. Bufton 1992. The Mars Observer laser altimeter investigation. J. Geophys. Res. 97, 7781-7797.
|
Table 1. 1995-1997 HST Mars 1042 nm Images Used in this Study |
||||||||
|
UT Date |
Time |
Diameter |
Sub-Earth |
Phase |
Ls |
Resolutionb |
||
|
YYMMDD |
UT |
Image Namea |
arcsec |
Lat. |
Lon. |
° |
° |
km/pix |
|
HST Cycle 4 Data |
||||||||
|
950224 |
13:34 |
2mi0703t1 |
13.5 |
17.5 |
232.5 |
9.7 |
63.1 |
22.7 |
|
950225 |
20:15 |
2mi0a03t1 |
13.5 |
17.5 |
312.8 |
11.5 |
63.6 |
22.8 |
|
950226 |
01:06 |
2mi0103t1 |
13.4 |
17.4 |
23.8 |
11.6 |
64.0 |
22.8 |
|
950226 |
06:00 |
2mi0403t1 |
13.4 |
17.4 |
95.5 |
11.8 |
64.1 |
22.8 |
|
HST Cycle 5 Data |
||||||||
|
950706 |
03:42 |
2q95107t1 |
5.5 |
26.0 |
280.5 |
35.9 |
122.1 |
55.1 |
|
950706 |
11:45 |
2q95207t1 |
5.5 |
26.0 |
38.0 |
35.8 |
122.3 |
55.2 |
|
950711 |
23:40 |
2q95307t1 |
5.4 |
26.1 |
163.1 |
35.3 |
124.9 |
56.4 |
|
950802 |
21:43 |
2q96107t1 |
5.0 |
25.5 |
279.6 |
32.9 |
135.4 |
61.0 |
|
950821 |
09:43 |
2q97107t1 |
4.8 |
23.8 |
278.3 |
30.5 |
144.6 |
64.3 |
|
HST Cycle 6 Data |
||||||||
|
960918 |
20:42 |
3gi6208t1 |
4.6 |
16.8 |
169.2 |
29.3 |
11.4 |
65.9 |
|
961008 |
16:44 |
3gi6307t1 |
5.0 |
20.3 |
277.2 |
31.9 |
20.9 |
61.8 |
|
961009 |
00:50 |
3gi6407t1 |
5.0 |
20.5 |
35.4 |
31.9 |
21.3 |
61.7 |
|
961015 |
14:23 |
3gi6507t1 |
5.1 |
21.3 |
175.0 |
32.7 |
24.1 |
60.1 |
|
961129 |
18:36 |
3gi6608t1 |
6.4 |
24.5 |
161.4 |
36.3 |
45.1 |
47.8 |
|
961230 |
06:33 |
3gi7008t1 |
8.0 |
23.9 |
49.5 |
35.6 |
58.3 |
38.4 |
|
970104 |
00:44 |
3gi6908t1 |
8.3 |
23.8 |
277.3 |
35.1 |
60.1 |
36.9 |
|
970104 |
18:18 |
3gi6808t1 |
8.3 |
23.8 |
173.9 |
35.0 |
60.4 |
36.7 |
|
970330 |
04:33 |
3gi7407r1 |
14.0 |
23.4 |
288.4 |
10.7 |
97.4 |
21.9 |
|
970330 |
11:00 |
3gi7107r1 |
14.0 |
23.4 |
23.3 |
10.9 |
97.6 |
21.9 |
|
970330 |
15:55 |
3gi7207r1 |
14.0 |
23.4 |
95.3 |
11.1 |
97.7 |
21.9 |
|
970330 |
22:18 |
3gi7302r1 |
14.0 |
23.4 |
188.7 |
11.3 |
97.8 |
21.9 |
|
970417 |
22:39 |
3gi7507r1 |
12.7 |
24.0 |
34.4 |
23.6 |
105.9 |
24.1 |
|
970517 |
17:47 |
3gi7707r1 |
10.2 |
25.3 |
47.9 |
35.4 |
119.2 |
30.1 |
|
970518 |
03:04 |
3gi7807r1 |
10.1 |
25.3 |
183.5 |
35.4 |
119.7 |
30.4 |
|
970518 |
09:31 |
3gi7907r1 |
10.1 |
25.3 |
277.8 |
35.4 |
119.7 |
30.4 |
|
970627 |
14:24 |
3gi8207r1 |
7.6 |
26.0 |
328.0 |
40.5 |
139.4 |
40.3 |
|
970627 |
17:37 |
3gi8307r1 |
7.6 |
26.0 |
15.0 |
40.5 |
139.4 |
40.3 |
|
970627 |
21:10 |
3gi8407r1 |
7.6 |
26.0 |
66.8 |
40.5 |
139.4 |
40.3 |
|
a Base name for locating image data and other ancillary information from the HST Data Archive.b Maximum spatial resolution at the sub-Earth point. |
||||||||
Table 2. 1042 nm Normal Albedos and Phase Coefficients
|
Region |
1042 nm Normal Albedo |
1042 nm Phase Coefficient |
|
Average Bright: 0.3 < (I/F)M < 0.4 |
0.361 |
0.0032 mag/deg |
|
Average Intermediate: 0.2 < (I/F)M < 0.3 |
0.242 |
-0.0010 |
|
Average Dark: 0.1 < (I/F)M < 0.2 |
0.179 |
0.0038 |
|
Average Polar: (I/F)M > 0.35, Lat. > +80° |
0.386 |
0.0007 |
|
Arabia |
0.409 |
0.0056 |
|
Isidis |
0.392 |
0.0090 |
|
Viking Lander 2 Site |
0.381 |
0.0074 |
|
Viking Lander 1 Site |
0.346 |
0.0082 |
|
Pathfinder Landing Site |
0.332 |
0.0058 |
|
Syrtis Major |
0.176 |
0.0127 |
|
Mare Acidalium |
0.168 |
0.0058 |
Figures and Captions
Go Back to where figure first cited in text...
Go Back to where figure first cited in text...
Go Back to where figure first cited in text...
Go Back to where figure first cited in text...